This article contains AI generated content.
· UpdatedDiabetes Mellitus Genes and Biomarkers — 6 Genes and 7 Biomarkers to Track
Introduction
Living with diabetes risk — or with a recent diagnosis — often means navigating advice that feels both familiar and frustratingly insufficient. Eat less sugar. Move more. Lose weight. These recommendations are not wrong, but for many people they fall short of explaining why two individuals following the same diet can have vastly different outcomes. That gap is rarely addressed in a standard checkup.
The way diabetes prevention and management is still taught is built around population averages. A fasting glucose below 100 mg/dL and an HbA1c below 5.7% are thresholds derived from large cohort studies — not personalized safety lines. For some people they are meaningful. For others, particularly those with specific genetic variants or early metabolic dysfunction, staying within the "normal" range remains compatible with quietly progressing insulin resistance. Conventional labs can look fine while the metabolism drifts further off course.
This article takes a more precise approach. Rather than general principles, the focus is on specific measurable numbers and their actionable meaning — what to test, what your results actually indicate, and what to do differently based on your own data. Two parallel frameworks are presented: a biomarker panel you can track over time to monitor your metabolic state, and a set of genetic variants with established type 2 diabetes associations that explain where your biology may need targeted support rather than generic effort.
Neither track offers simple answers or miracle corrections. What they offer is clarity. Better information leads to better questions, better conversations with clinicians, and better decisions about which interventions are worth trying first. The combination of measurable biomarkers and genetic context creates something rare in chronic disease management: a view of what is actually happening beneath the surface, and a starting point for changing it.
7 Biomarkers to Monitor and Improve
Biomarkers tracked over time tell a story that a single annual checkup cannot. Together, the seven markers below form a practical metabolic panel that goes well beyond standard diabetes screening. Several are routinely emphasized by clinicians focused on preventive and longevity medicine — including Peter Attia, Thomas Dayspring, and Allan Sniderman — precisely because they reveal dysfunction years before it appears in conventional tests.
1. Fasting Glucose
Why it matters: Fasting plasma glucose is the most ordered diabetes screening test. It reflects how well the body clears blood sugar during an overnight fast, and when chronically elevated it signals that the liver is overproducing glucose and that peripheral cells are becoming resistant to insulin.
What it may reveal: A single value is a snapshot. A trend is the real signal. Fasting glucose creeping from 82 to 90 to 98 mg/dL over three consecutive annual labs is a meaningful trajectory even though each value sits in the "normal" range. The ADA defines prediabetes at 100–125 mg/dL and type 2 diabetes at 126 mg/dL or above on two separate tests. Many preventive clinicians consider anything above 90 mg/dL worth examining in context.
How to measure it: Standard fasting blood draw at any laboratory, included in basic or comprehensive metabolic panels. Requires a 10–12 hour fast. Cost range: $10–$30 out of pocket; typically included with insurance at annual visits.
If the score is bad — the plan without supplements: A walk of 10–20 minutes after each main meal is one of the most evidence-consistent interventions for postprandial and fasting glucose reduction. A diet that replaces refined carbohydrates with protein, fiber, and healthy fats reduces the glucose burden on the liver. Time-restricted eating (eating within an 8–10 hour daily window) reduces overnight hepatic glucose output. Resistance training three times per week increases muscle's capacity to absorb glucose without requiring high insulin output. Target: bring fasting glucose below 90 mg/dL, not merely below 100 mg/dL.
If the score is bad — the plan with supplements or equipment: A continuous glucose monitor (CGM) — available through services like Levels or Dexterity — provides real-time feedback that is far more actionable than a quarterly blood draw. It identifies exactly which foods, sleep patterns, or stress events spike glucose, allowing precise adjustments. For supplementation: berberine at 500 mg taken 2–3 times daily with meals has been shown in multiple clinical trials to reduce fasting glucose comparably to low-dose metformin. Recommended cycling: 8 weeks on, 4 weeks off to prevent gut adaptation. Side effects: digestive discomfort in some individuals at the start; reduce dose if this occurs. If fasting glucose remains elevated despite consistent lifestyle efforts, a clinical conversation about metformin is appropriate.
2. HbA1c (Glycated Hemoglobin)
Why it matters: HbA1c measures the percentage of hemoglobin that has become glycated (glucose-bound) over the previous 2–3 months. It is the gold-standard marker for long-term glycemic control and is used both to diagnose prediabetes (5.7–6.4%) and type 2 diabetes (6.5% and above).
What it may reveal: While useful, HbA1c has documented limitations. It can be falsely lowered by high red blood cell turnover (hemolytic anemia, post-blood loss) and falsely elevated by iron deficiency or certain genetic hemoglobin variants. Peter Attia consistently emphasizes pairing HbA1c with fasting insulin and post-meal glucose data rather than relying on it as a standalone marker. An HbA1c below 5.4% is considered optimal by many preventive-focused clinicians.
How to measure it: Standard blood test ordered as part of most metabolic panels. Cost range: $20–$50 out of pocket; included in most annual labs with insurance.
If the score is bad — the plan without supplements: Sustained reduction in dietary carbohydrate load — particularly refined grains and added sugars — predictably lowers HbA1c across clinical populations. A Mediterranean-style dietary pattern has the strongest evidence base among whole-diet approaches, showing consistent HbA1c reductions in multiple large randomized trials. Aerobic exercise at 150+ minutes per week combined with resistance training has an independent HbA1c-lowering effect that is not fully explained by weight loss.
If the score is bad — the plan with supplements or equipment: Magnesium glycinate or malate at 300–400 mg/day has shown modest HbA1c-lowering effects in populations with magnesium insufficiency, which is common in people with insulin resistance. Multiple meta-analyses have found that oral magnesium supplementation significantly improved fasting glucose and HbA1c in people with type 2 diabetes or prediabetes. Berberine (as above) also lowers HbA1c in sustained use. Cycling magnesium: generally safe as continuous supplementation; recheck serum magnesium every 6 months. A CGM helps identify hidden postprandial glucose spikes that elevate HbA1c without dramatically raising fasting glucose.
3. Fasting Insulin
Why it matters: This is arguably the most important and most underused marker in standard diabetes care. Most clinicians order fasting glucose but not fasting insulin — even though elevated fasting insulin (hyperinsulinemia) is typically the first metabolic abnormality to appear, often a decade before fasting glucose rises to diagnostic thresholds.
What it may reveal: High fasting insulin means the pancreas is working hard to keep glucose in check against growing cellular resistance. Optimal fasting insulin is typically considered below 8–10 µIU/mL by preventive clinicians, even though many lab reference ranges label anything below 25 µIU/mL as "normal." An elevated fasting insulin with a still-normal fasting glucose is a common early pattern that standard screening misses entirely.
How to measure it: A simple blood test, but it must be specifically ordered — it is not part of standard metabolic panels. Requires a true 10–12 hour fast for accuracy. Cost range: $30–$70 out of pocket; included in some functional medicine metabolic packages.
If the score is bad — the plan without supplements: The most direct lever is reducing insulin secretion demand. This means: significantly reducing refined carbohydrate and added sugar intake, extending the overnight fasting window, eliminating frequent snacking (which causes repeated small insulin spikes throughout the day), and increasing physical activity especially through strength training. Insulin falls predictably when eating frequency and carbohydrate load decrease together — the mechanism is straightforward and well-established.
If the score is bad — the plan with supplements or equipment: Myo-inositol (2–4 g/day) has shown insulin-sensitizing effects in clinical trials, particularly in women with PCOS but with broader implications for insulin resistance generally. Alpha-lipoic acid (300–600 mg/day) is another option with some randomized trial support for improving insulin sensitivity. A CGM helps identify post-meal glucose and insulin dynamics by proxy: large, prolonged glucose spikes imply large insulin responses that can be reduced through dietary modification. Cycling inositol: generally continuous use; no established cycling protocol. Side effects minimal at standard doses.
4. HOMA-IR (Homeostatic Model Assessment of Insulin Resistance)
Why it matters: HOMA-IR is not a separate blood test — it is a calculated index using fasting insulin and fasting glucose together. The formula (in mg/dL units): (fasting insulin µIU/mL × fasting glucose mg/dL) ÷ 405. Matthews et al. (1985) validated this model against glucose clamp studies — the clinical gold standard for measuring insulin resistance — making it a reliable, practical proxy for a technically demanding procedure.
What it may reveal: A HOMA-IR above 1.5 suggests emerging insulin resistance; above 2.5 is clearly problematic; above 5.0 is associated with frank type 2 diabetes. Many preventive clinicians consider anything above 1.0 worth addressing. Crucially, HOMA-IR can reveal significant metabolic dysfunction when fasting glucose and HbA1c still appear normal — making it one of the most valuable early indicators available.
How to measure it: Calculated from fasting glucose and fasting insulin results (both described above). No additional blood draw needed; many online calculators are available. Combined cost range: $40–$80 out of pocket for both inputs.
If the score is bad — the plan without supplements: HOMA-IR responds strongly to the same interventions that lower fasting insulin: time-restricted eating, low-carbohydrate or Mediterranean diet, resistance training, and consistent aerobic exercise. Sleep quality is a significant and often overlooked driver — even one week of sleep restriction to 6 hours or less increases HOMA-IR measurably in healthy adults. Prioritizing 7–9 hours of quality sleep is a meaningful metabolic intervention in its own right, not just a recovery behavior.
If the score is bad — the plan with supplements or equipment: Berberine, inositol, and alpha-lipoic acid all have HOMA-IR-relevant evidence across their respective trials. Beyond supplementation: a body composition scale (such as those using bioelectrical impedance) that tracks muscle mass alongside fat helps verify that lifestyle interventions are improving the metabolically active tissue that drives insulin sensitivity. Since muscle is the primary site of insulin-mediated glucose disposal, building and maintaining muscle mass is mechanistically central to improving HOMA-IR.
5. Triglyceride/HDL Ratio
Why it matters: The ratio of fasting triglycerides to HDL cholesterol is a powerful and underappreciated proxy for insulin resistance and cardiometabolic risk. Thomas Dayspring and Allan Sniderman have both emphasized that in people with metabolic dysfunction, this ratio is more clinically meaningful than total cholesterol. A high TG/HDL ratio reflects a metabolic environment that promotes small, dense LDL particles — the most atherogenic lipoprotein phenotype.
What it may reveal: A TG/HDL ratio below 2.0 (using mg/dL units) is generally considered favorable. Above 3.5 is a strong indicator of insulin resistance, often appearing before significant rises in fasting glucose or HbA1c. It is particularly valuable in the early stages of metabolic deterioration when standard glucose markers still appear reassuring. Note: this ratio uses mg/dL values; different cutoffs apply in mmol/L systems.
How to measure it: Both triglycerides and HDL are included in any standard lipid panel. The ratio is calculated manually by dividing TG by HDL. Cost range: typically $20–$50 out of pocket; included in most annual labs with insurance.
If the score is bad — the plan without supplements: Dietary refined carbohydrates — especially added sugars, fruit juices, and processed grains — are the primary dietary driver of elevated triglycerides and low HDL. Reducing these foods is the most effective lifestyle intervention; the response in triglycerides can be seen within 2–4 weeks of meaningful dietary change. Alcohol has a significant independent effect on triglycerides and should be substantially reduced. Regular moderate aerobic exercise (150+ minutes per week) raises HDL and lowers triglycerides with consistent evidence across populations.
If the score is bad — the plan with supplements or equipment: Omega-3 fatty acids (EPA + DHA combined) at 2–4 g/day have strong randomized controlled trial evidence for lowering triglycerides — one of the most replicated supplement effects in lipid research. The REDUCE-IT trial demonstrated significant cardiovascular event reduction with 4 g/day of EPA in high-risk patients with elevated triglycerides. For primary prevention, 2–3 g/day of EPA + DHA from a high-quality fish oil is a reasonable starting point. Side effects: fishy aftertaste, potential blood-thinning effect at high doses — caution if on anticoagulants. Cycling: can be used continuously; re-test the lipid panel at 3 months to confirm response.
6. High-Sensitivity C-Reactive Protein (hs-CRP)
Why it matters: Chronic low-grade inflammation is now recognized as both a driver and a consequence of insulin resistance. hs-CRP is the most widely accessible clinical marker of systemic inflammatory activity. Elevated hs-CRP independently predicts incident type 2 diabetes and cardiovascular disease, even after controlling for other risk factors. It reflects the inflammatory environment in which insulin resistance accelerates — not a diabetes marker specifically, but a powerful metabolic context marker.
What it may reveal: An hs-CRP below 1.0 mg/L is considered optimal. Between 1.0–3.0 mg/L suggests moderate metabolic and cardiovascular risk. Above 3.0 mg/L indicates high inflammatory burden. Importantly, standard CRP tests are less sensitive than hs-CRP and should not be substituted; they are different tests that operate on different concentration ranges.
How to measure it: A specific blood test that must be explicitly ordered as hs-CRP. Ideally measured on two occasions at least two weeks apart to distinguish chronic elevation from temporary inflammation due to infection, injury, or illness. Cost range: $20–$50 out of pocket.
If the score is bad — the plan without supplements: Sleep quality has one of the strongest associations with hs-CRP in population data. Consistent 7–9 hours of quality sleep reduces inflammatory markers measurably over 8–12 weeks. An anti-inflammatory dietary pattern — rich in polyphenols, vegetables, fatty fish, and olive oil, and low in ultra-processed foods — consistently lowers hs-CRP in intervention studies. Chronic psychological stress independently elevates cortisol and inflammatory markers and should not be overlooked as a driver.
If the score is bad — the plan with supplements or equipment: High-dose omega-3s (as above) reduce hs-CRP with strong clinical evidence. Curcumin in a high-bioavailability form (theracurmin or BCM-95 formulation) at 500–1000 mg/day has multiple randomized trials showing hs-CRP reduction. Cycling curcumin: 12 weeks on, 4 weeks off is commonly recommended; continuous use also appears safe in most people. Side effects: minimal; may potentiate blood-thinning medications. Regular sauna sessions (3–4 times per week, 20 minutes at 80–90°C) have shown significant hs-CRP reduction in Finnish cohort studies and several prospective analyses — a behavioral intervention with mounting metabolic evidence.
7. Uric Acid
Why it matters: Uric acid is less discussed in mainstream diabetes conversations but carries a clinically meaningful relationship with insulin resistance and metabolic syndrome. Elevated uric acid impairs nitric oxide production, promotes low-grade inflammation, and independently predicts incident type 2 diabetes and cardiovascular disease. Researcher Richard Johnson has published extensively linking fructose-driven uric acid elevation to a metabolic mechanism that connects diet directly to insulin resistance.
What it may reveal: Optimal uric acid is generally considered below 5.5 mg/dL for men and below 4.5 mg/dL for women, though reference ranges vary by laboratory. Levels above 7 mg/dL in men and above 6 mg/dL in women are associated with both gout risk and elevated metabolic risk. In people with normal glucose but elevated uric acid and triglycerides, early metabolic syndrome is a likely finding.
How to measure it: Included in a basic or comprehensive metabolic panel, or ordered separately. Cost range: $10–$30 out of pocket.
If the score is bad — the plan without supplements: Fructose — particularly from added sugars, sweetened beverages, and high-fructose corn syrup — is the primary dietary driver of uric acid elevation. Removing sugary drinks and highly processed foods has an immediate and significant effect on uric acid levels within weeks. Staying well hydrated increases renal uric acid clearance. Reducing alcohol — particularly beer, which is high in purines — is also important.
If the score is bad — the plan with supplements or equipment: Quercetin (500–1000 mg/day) inhibits xanthine oxidase — the same enzyme targeted by prescription allopurinol — and has small trial evidence for lowering uric acid. Tart cherry extract has shown modest uric acid-lowering effects in trials, particularly relevant for people with a history of gout. Vitamin C at 500–1000 mg/day increases renal uric acid excretion with consistent small trial support. Cycling quercetin: 8 weeks on, 4 weeks off is often recommended. Side effects: minimal; quercetin may interact with certain antibiotics and immunosuppressants. If uric acid remains high despite these interventions, a clinical discussion about xanthine oxidase inhibitors is appropriate.
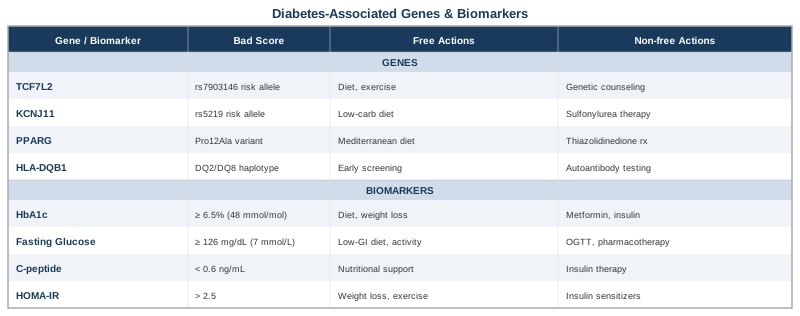
With a clear picture of which biomarkers matter and what to do when they are off, the next layer to understand is the genetic architecture underneath them — the variants that explain why some people are more vulnerable to metabolic dysfunction in the first place.
The Genetic Picture: 6 Genes That Shape Your Diabetes Risk
Type 2 diabetes is a polygenic condition — risk accumulates across dozens to hundreds of variants, none of which acts as a single deterministic cause. But several genes have strong, replicated human evidence linking specific variants to meaningful increases in risk through identifiable biological mechanisms. Understanding which of these variants you carry changes the question from "how do I prevent diabetes in general?" to "where does my biology specifically need support?" Genetic testing through consumer or clinical panels is accessible and relatively affordable — and the variants below are among the best candidates to start with.
TCF7L2 — The Most Replicated Diabetes Gene
What it affects: Transcription factor 7-like 2 (TCF7L2) is the most consistently and strongly associated gene with type 2 diabetes risk in populations of European, African, and Asian ancestry. The risk variant (rs7903146, T allele) impairs insulin secretion from pancreatic beta cells and reduces the incretin effect — the gut-hormone amplification of insulin release that occurs after meals. Grant et al. (2006) identified this association in a landmark Nature Genetics paper; it has been replicated across hundreds of subsequent studies. Carriers of two risk alleles (TT genotype) have approximately 40% higher lifetime risk of type 2 diabetes compared to CC homozygotes.
If the gene variant is present — the plan without supplements: Because TCF7L2 risk primarily reduces insulin secretory capacity, the strategic goal is to minimize secretion demand on pancreatic beta cells. A low-glycemic diet that limits large carbohydrate boluses is particularly important: the blunted incretin effect means glucose clearance after carbohydrate-heavy meals is slower and less efficient. Consistent meal timing reduces unpredictable secretory stress. Time-restricted eating (16:8) provides rest periods for beta cells. Physical activity — both aerobic and resistance training — enables glucose disposal through insulin-independent mechanisms, directly bypassing the secretion deficit.
If the gene variant is present — the plan with supplements or equipment: Berberine (500 mg, 2–3 times/day with meals, cycled 8 weeks on / 4 weeks off) has a directly relevant mechanism: it stimulates GLP-1 secretion from intestinal L-cells, partially restoring the incretin effect that TCF7L2 risk variants impair. A CGM is especially valuable for TCF7L2 risk carriers — it identifies which foods cause the largest glycemic excursions that your beta cells are least equipped to handle. Side effects of berberine: GI discomfort in some people; reduce dose if this occurs and titrate up gradually.
PPARG — The Fat Cell Regulation Gene
What it affects: The PPARG gene encodes PPAR-gamma, a nuclear receptor that regulates fat cell differentiation, fatty acid storage, and insulin sensitivity in adipose tissue. PPAR-gamma is the molecular target of thiazolidinedione medications (rosiglitazone, pioglitazone) used in type 2 diabetes — which confirms the pathway's direct clinical relevance. The common Pro12Ala variant has been associated with mildly reduced type 2 diabetes risk; rarer loss-of-function variants are associated with severe insulin resistance. The most clinically important context is that PPAR-gamma activity is substantially modifiable by dietary fat composition and body fat distribution.
If the gene variant is present — the plan without supplements: Dietary fat quality matters significantly for people with PPARG variants. Monounsaturated fats (olive oil, avocados, macadamia nuts) activate PPAR-gamma beneficially, while a diet high in processed saturated fats and refined seed oils may not provide the same activation. A Mediterranean-style dietary pattern — high in olive oil, vegetables, fish, and legumes — aligns directly with PPAR-gamma biology. Visceral fat reduction through sustained aerobic exercise is also important, since adipose tissue inflammation is a central mechanism through which PPARG dysregulation impairs metabolic health.
If the gene variant is present — the plan with supplements or equipment: Extra-virgin olive oil (3–4 tablespoons daily as part of the diet) provides oleic acid that activates PPAR-gamma receptors, offering a food-first PPAR-gamma agonist effect. This is one mechanistic reason why Mediterranean diet studies show particular benefit in people with metabolic risk factors. Omega-3 fatty acids activate PPAR-alpha and have complementary anti-inflammatory and insulin-sensitizing effects. Both can be used continuously as part of dietary pattern; no cycling protocol applies. Note on calories: olive oil is calorie-dense — relevant if total caloric management is part of the plan.
KCNJ11 — The Insulin Release Channel Gene
What it affects: KCNJ11 encodes Kir6.2, a subunit of the ATP-sensitive potassium channel in pancreatic beta cells. This channel is the essential trigger mechanism by which rising intracellular glucose leads to insulin release. The E23K variant (rs5219) reduces channel sensitivity, meaning more glucose is needed to trigger the same insulin output. The result is delayed and blunted insulin secretion following carbohydrate intake — one of the most replicated beta cell secretion defect variants in type 2 diabetes genetics.
If the gene variant is present — the plan without supplements: Like TCF7L2, the KCNJ11 E23K variant impairs the secretory side of the insulin response. Postprandial glucose management is the critical priority: smaller carbohydrate servings at meals, careful pairing of carbohydrates with protein and fiber (to slow digestion and glucose delivery), and consistent post-meal walking significantly reduce the burden on a less-responsive secretory system. Avoiding large carbohydrate boluses — even from ostensibly healthy sources like fruit, whole grains, or legumes in excess — is particularly important for people with known or suspected KCNJ11 risk variants.
If the gene variant is present — the plan with supplements or equipment: Chromium picolinate (200–400 mcg/day) has some clinical trial evidence for improving glucose tolerance and beta cell function. Evidence quality is moderate but the side effect profile is favorable at standard doses — it is a low-risk option worth considering. Myo-inositol (2–4 g/day) supports insulin signaling downstream of the secretory step, partially compensating for the reduced secretion that the variant produces. A CGM is particularly valuable for KCNJ11 carriers to identify personal post-meal glucose patterns and test which carbohydrate amounts and combinations remain manageable. Side effects of chromium: generally well-tolerated; avoid high doses above 1000 mcg/day; cycling not well established.
FTO — The Appetite and Body Weight Gene
What it affects: The FTO gene (Fat mass and Obesity associated) became prominent in 2007 when Frayling et al. identified a strong genome-wide association between FTO variants and body mass index in 38,759 Europeans. The risk allele (rs9939609, A allele) is associated with increased appetite, reduced satiety signaling, and higher body weight — which elevates diabetes risk through increased visceral adiposity and insulin resistance. Each risk allele adds approximately 0.4 kg of body weight on average. The mechanism appears to involve altered expression of appetite-regulating circuits in the hypothalamus.
If the gene variant is present — the plan without supplements: Critically, multiple large studies show that physical activity substantially attenuates the FTO risk effect — active carriers have significantly lower realized risk than sedentary carriers. The gene is not fate; it is a bias toward weight gain that consistent exercise overrides. Protein-rich meals are particularly relevant for FTO risk carriers: high-protein meals increase satiety hormone signaling more effectively than equivalent calorie intake from carbohydrates or fats. Practical approach: prioritize 30+ grams of protein at each main meal, remove highly palatable ultra-processed foods from the home environment to reduce exposure-driven eating, and maintain 150+ minutes per week of aerobic activity.
If the gene variant is present — the plan with supplements or equipment: Glucomannan (1–2 g taken with water before meals) increases meal satiety and has modest trial evidence for reducing caloric intake. Whey or plant-based protein supplement (20–30 g around exercise) supports muscle maintenance during caloric restriction — important since FTO risk carriers may have higher lean mass needs during weight management phases. A body composition tracker (smart scale with bioelectrical impedance or DEXA scan annually) distinguishes fat loss from muscle loss — a meaningful distinction when managing weight long-term in people with FTO variants. Side effects of glucomannan: GI tolerance varies; take with at least 250 mL of water to prevent esophageal issues.
SLC30A8 — The Zinc Transporter Gene
What it affects: SLC30A8 encodes ZnT8, a zinc transporter concentrated in pancreatic beta cells. Zinc is essential for insulin crystallization, packaging, and secretion — without adequate zinc transport into beta cell secretory granules, insulin processing is impaired. Multiple common variants in SLC30A8 alter ZnT8 function and have been associated with type 2 diabetes risk across multiple genome-wide association studies. Interestingly, the biology is complex: some rare loss-of-function variants are actually protective, while common risk variants reduce zinc transport efficiency.
If the gene variant is present — the plan without supplements: Dietary zinc sufficiency is the first priority. The highest dietary zinc sources are shellfish (especially oysters — one of the richest zinc foods known), red meat, pumpkin seeds, hemp seeds, and legumes. Factors that deplete zinc status include excessive alcohol, very high phytate diets (untreated legumes and grains without soaking or fermenting), and chronic stress-related zinc loss through sweat and urine. A varied whole-food diet with adequate animal protein typically provides sufficient zinc, but those on predominantly plant-based diets may need to pay closer attention.
If the gene variant is present — the plan with supplements or equipment: Zinc bisglycinate or zinc picolinate at 15–25 mg/day offers good bioavailability and has been studied in diabetes-related contexts, with modest but consistent evidence for supporting insulin secretion and glucose regulation. Critical note: long-term zinc supplementation above 25 mg/day can deplete copper through competitive absorption — always co-supplement with 1–2 mg of copper if using zinc long-term. Cycling: test serum zinc before supplementing; use 12 weeks on / 4 weeks off if supplementing without baseline deficiency confirmed. Side effects: nausea if taken on an empty stomach; always take with food.
MTNR1B — The Circadian Clock and Insulin Gene
What it affects: MTNR1B encodes melatonin receptor 1B, expressed in pancreatic beta cells. Risk variants (rs10830963, G allele) increase receptor sensitivity to melatonin, causing stronger suppression of insulin secretion during melatonin-active periods — primarily the evening and night. Prokopenko et al. (2009) established this association through a large genome-wide association study. The clinical implication is specific: MTNR1B risk carriers who eat close to or after their typical bedtime have a significantly blunted insulin response to food because elevated melatonin is actively suppressing their beta cells at precisely the moment they are eating.
If the gene variant is present — the plan without supplements: Time-restricted eating with a strict eating cut-off 2–3 hours before sleep is the single most relevant intervention for MTNR1B risk carriers. For someone sleeping at 11pm, this means ending eating by 8pm at the latest. Morning light exposure (10–15 minutes outdoors within 30–60 minutes of waking) strengthens the circadian boundary between melatonin-active and melatonin-inactive phases, sharpening the timing of metabolic functions. Large carbohydrate meals in the evening are particularly problematic for this genotype — the beta cell suppression that melatonin causes falls precisely when those meals demand an insulin response.
If the gene variant is present — the plan with supplements or equipment: Melatonin supplementation caution: MTNR1B risk carriers have heightened receptor sensitivity, which means supplemental melatonin in the evening will further suppress insulin secretion — amplifying the risk variant's effect. If melatonin is used for sleep support, use the lowest effective dose (0.3–0.5 mg, not the common 5–10 mg products) and take it well after the last meal. A sleep tracker (Oura Ring or equivalent) helps verify consistent sleep timing — irregular circadian timing is independently disruptive for MTNR1B risk carriers. No established cycling protocol applies to melatonin; minimize dose and maintain consistent timing relative to both sleep and last meal.
What Jason Fung's "The Diabetes Code" Gets Right
The Diabetes Code by Jason Fung (2018) represents one of the most substantive challenges to mainstream diabetes management to appear in accessible clinical writing. Fung is a nephrologist whose daily work treating dialysis patients gave him a clinical vantage point on the consequences of poorly controlled diabetes — and the incentives that perpetuate inadequate treatment. The book argues that type 2 diabetes is a dietary disease that is both preventable and, in many cases, reversible. While not every claim has been confirmed at the highest evidence level, many are directly supported by randomized trials and large cohort studies that most patients never hear about.
1. Insulin Resistance Is the Core Problem — Not High Blood Sugar
Treating elevated blood sugar with more insulin, Fung argues, is like bailing water from a flooding boat without fixing the hole. Blood sugar elevation is a symptom; chronic hyperinsulinemia and insulin resistance are the underlying disease. Prescribing additional insulin to a patient who already cannot respond adequately to their own supply adds more of the problem substance to an already overwhelmed system.
2. Cells Become Insulin-Resistant Because They Are Already Overfull
The model presented: cells resist insulin because they are saturated with stored glucose and fat beyond their capacity. Insulin resistance in this framing is a protective mechanism — an overflow defense — not a mysterious malfunction. The solution is not to force more glucose into cells using pharmacological insulin doses but to reduce total glucose availability through dietary change and fasting.
3. Hyperinsulinemia Precedes Hyperglycemia by a Decade
Elevated fasting insulin appears years before fasting glucose rises to diagnostic thresholds. Fung makes this point emphatically — it is consistent with the biomarker section above. Measuring fasting insulin is not standard of care in most countries, but he argues compellingly that it should be, because it reveals the dysfunction at a stage where dietary intervention alone can fully reverse it.
4. Frequent Eating Keeps Insulin Chronically Elevated
The modern eating pattern — three meals plus multiple snacks — means insulin is almost never given a genuine opportunity to fall. Even small insulin responses to minor snacking between meals prevent complete metabolic recovery. The metabolic environment required for restoring insulin sensitivity requires real fasting periods between eating events — not just smaller meals.
5. Intermittent Fasting Lowers Insulin More Effectively Than Caloric Restriction Alone
Fung cites multiple clinical studies showing that structured fasting — from 16:8 time-restricted eating to 24–36 hour extended fasts — reduces insulin levels more effectively than equivalent caloric restriction without fasting. The mechanism is direct: no food equals no glucose stimulus equals no insulin secretion. This allows cells to begin drawing down their excess glucose stores and progressively restore receptor sensitivity.
6. All Calories Are Not Equal — The Hormonal Response Matters
The book challenges the dominant "calories in, calories out" model by demonstrating that different macronutrients produce different hormonal responses with different metabolic consequences. Fructose drives hepatic fat production (de novo lipogenesis) without meaningfully suppressing appetite — a particularly dangerous combination for metabolic health. 100 calories of fructose and 100 calories of protein are not metabolically equivalent despite being numerically identical.
7. Visceral and Ectopic Fat Are the Real Metabolic Problem
Fung distinguishes between subcutaneous fat (under the skin, relatively metabolically benign) and visceral fat (around the organs) and ectopic fat (inside organs — particularly the liver). Hepatic fat accumulation (non-alcoholic fatty liver disease) is the primary driver of hepatic insulin resistance and is strongly associated with type 2 diabetes. Reducing liver fat — which responds quickly to dietary carbohydrate restriction and fasting — is central to metabolic reversal in his model.
8. The Low-Fat Dietary Guidelines Contributed to the Epidemic
The book reviews the scientific and political history behind the 1977 U.S. dietary guidelines, arguing that the push to reduce dietary fat led to its systematic replacement with refined carbohydrates and added sugar in packaged foods. The subsequent explosion in metabolic disease rates is presented as a predictable consequence of replacing one macronutrient with the one most directly implicated in insulin-driven fat storage and metabolic dysfunction.
9. Caloric Restriction Without Insulin Reduction Fails Long-Term
Fung references research showing that chronic caloric restriction causes the body to compensate by reducing basal metabolic rate, making long-term success statistically rare. Fasting, by contrast, appears to maintain or even briefly increase metabolic rate during the fasting period while achieving greater reductions in insulin. The long-term failure of most calorie-restriction interventions is not primarily a willpower problem — it is a metabolic adaptation to sustained restriction.
10. Type 2 Diabetes Reversal Requires Removing the Cause — Not Managing the Symptom
The most clinically impactful argument in the book: a disease caused by excess dietary glucose and chronic hyperinsulinemia can be reversed by removing those causes. This is not merely theoretical. The DiRECT trial (Lean et al., The Lancet, 2018) provided robust randomized evidence that intensive dietary intervention achieving substantial weight loss led to diabetes remission in 46% of participants at one year. Roy Taylor's Newcastle Protocol had earlier demonstrated liver fat depletion and beta cell function restoration through very low caloric intake. These trials validate the core mechanistic argument Fung builds.
Complementary Approaches With Meaningful Clinical Evidence
Beyond biomarker tracking and dietary strategy, several complementary modalities have genuine human clinical trial evidence for type 2 diabetes or the metabolic pathways that drive it. The three selected here have the best combination of evidence quality and practical relevance for this condition.
Yoga
Yoga combines physical postures, controlled breathing, and relaxation — and this combination has documented effects on multiple metabolic pathways relevant to type 2 diabetes. Beyond the movement component, yoga reduces cortisol and sympathetic nervous system activation, both of which worsen insulin resistance independently of diet. Regular yoga practice has been associated in multiple trials with reductions in fasting glucose, HbA1c, triglycerides, and blood pressure in people with type 2 diabetes.
A systematic review and meta-analysis of 25 randomized controlled trials of yoga in type 2 diabetes patients found significant reductions in fasting blood glucose (mean reduction approximately 20 mg/dL), HbA1c, total cholesterol, and triglycerides compared to control groups. The most studied style is Hatha yoga, practiced 3–5 days per week for 30–60 minutes per session over 8–12 weeks. Effects were consistent across studies of varying design and population, suggesting the benefit is robust rather than study-specific.
A practical starting point: three sessions per week of beginner Hatha or restorative yoga, either in-person or through a structured online program. Consistency matters more than intensity — occasional practice is unlikely to produce significant metabolic changes. People with diabetes-related neuropathy or retinopathy should adapt specific postures with guidance from a knowledgeable instructor. The stress-reduction component makes yoga a particularly useful complement to dietary and exercise interventions in people with high stress loads.
Mindfulness Meditation and MBSR
Mindfulness-Based Stress Reduction (MBSR) is an 8-week structured program that trains sustained, non-judgmental present-moment awareness through formal meditation and body scan practices. Its relevance for diabetes operates on two levels: metabolic (chronic stress elevates cortisol, which promotes gluconeogenesis and worsens insulin resistance) and behavioral (mindfulness reduces emotional and stress-driven eating, improves dietary self-regulation, and supports long-term adherence to lifestyle changes).
Multiple randomized controlled trials and meta-analyses have found that MBSR participants with type 2 diabetes show meaningful reductions in HbA1c, perceived stress, depressive symptoms, and diabetes distress scores compared to control groups. The mechanism is partly neurohormonal — regular mindfulness practice demonstrably reduces cortisol reactivity and HPA axis dysregulation — and partly behavioral. The standard protocol involves 8 weekly group sessions of 2.5 hours each, one full-day silent retreat, and 40–45 minutes of daily home practice throughout.
A realistic entry point for most people is a daily 15–20 minute mindfulness practice using well-designed apps or audio guides, building toward the full MBSR format if possible through hospital-based or university programs. The key variable is consistency: scattered occasional practice produces limited metabolic benefit. For diabetes management specifically, combining mindfulness practice with meal journaling creates a powerful feedback loop between emotional state and eating behavior — a combination that addresses two of the most common drivers of dietary non-adherence.
Microbiome-Directed Therapies
The gut microbiome has emerged over the past decade as a significant factor in metabolic health and insulin sensitivity. Consistent differences in gut bacterial composition have been identified between people with type 2 diabetes and metabolically healthy controls across multiple large cohort studies. Specific bacterial genera — including Akkermansia muciniphila and various Lactobacillus species — are associated with improved insulin sensitivity and reduced systemic inflammation. The gut microbiome also produces short-chain fatty acids (butyrate, propionate, acetate) from fermented dietary fiber; these molecules have direct effects on intestinal glucose absorption, GLP-1 secretion, and hepatic glucose production.
A landmark study published in Science by Zhao et al. (2018) demonstrated that a dietary intervention specifically designed to selectively promote beneficial fiber-fermenting gut bacteria produced significantly greater reductions in HbA1c and fasting glucose compared to standard dietary advice in type 2 diabetes patients over 12 weeks. The intervention combined diverse fermentable fibers from whole grains, legumes, fruits, and vegetables to maximize microbial diversity and SCFA production. Fecal microbiota transplant studies in humans have further demonstrated short-term improvements in insulin sensitivity from microbiome transfer from healthy donors, providing mechanistic proof of concept.
Practical microbiome-directed approaches for diabetes: aim for 30+ different plant foods per week to maximize microbial diversity, incorporate fermented foods (kefir, kimchi, sauerkraut, plain yogurt) regularly, and consider targeted probiotic supplementation with strains that have metabolic-specific evidence. Akkermansia muciniphila is now available as a pasteurized supplement (Pendulum Glucose Control incorporates relevant strains) with some randomized trial support for HbA1c reduction in type 2 diabetes. The evidence in this area is promising and evolving — microbiome composition is highly individual, and responses to probiotic interventions vary considerably from person to person.
Taking the Next Step
Diabetes risk is not a fixed sentence. It is a process — driven by specific, measurable metabolic dysfunctions that begin years before diagnosis and respond meaningfully to targeted intervention at any stage. The biomarkers covered in this article provide a real-time metabolic dashboard that standard care largely ignores. The genetic variants explain why some people face steeper biological headwinds — and what to do about each one specifically. Together, they shift the conversation from passive management to active understanding.
The starting point is accessible: request fasting glucose, fasting insulin, HbA1c, a full lipid panel, hs-CRP, and uric acid at your next lab visit. Calculate HOMA-IR from the first two. If your TG/HDL ratio is above 2.5 or your fasting insulin is above 10, the interventions described here apply regardless of whether your glucose still looks normal. Genetic testing through a reputable consumer panel can reveal which of the six variants above are relevant to your biology.
None of this replaces working with a clinician — ideally one who integrates preventive and metabolic medicine — but it equips you to have a substantially more informed conversation about where to focus, what to test next, and which interventions are most likely to be useful for your specific biology rather than for the average patient in a clinical trial.
Digestive: Liver & Gallbladder Conditions Pancreatic Conditions
Endocrine & Metabolic: Diabetes & Blood Sugar Metabolic Syndrome Obesity